")
")

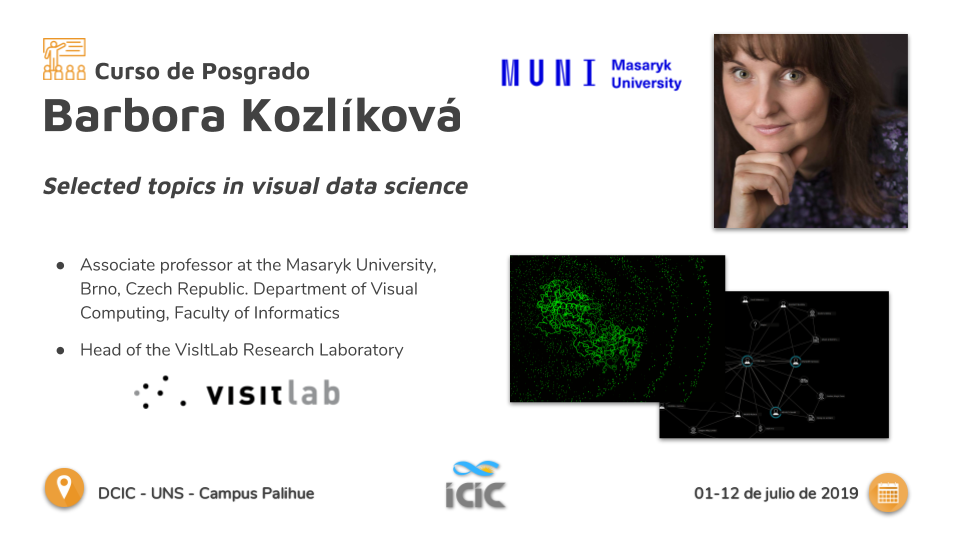
Selected Topics in Visual Data Science
Guest professor: Barbora Kozlíková, Associate Proffesor at the Masaryk University, Brno, Czech Republic. Head of visitlab, Faculty of Informatics at the Masaryk University.
This course is an introduction to key design principles and techniques for interactively visualizing and analyzing data in data science. The major goals of this course are to understand how human perception and cognition can help in the analysis and understanding of complex data, how to design and evaluate effective visual representations of data to support analysis, and how to create your own interactive visual data analysis.
This course is an introduction to key design principles and techniques for interactively visualizing and analyzing data in data science. The major goals of this course are to understand how human perception and cognition can help in the analysis and understanding of complex data, how to design and evaluate effective visual representations of data to support analysis, and how to create your own interactive visual data analysis.
Lessons
- Lesson 1: Introducction to visualization .pdf
- Lesson 2: Input data characteristics .pdf
- Lesson 3: Basic principles of visualization .pdf
- Lesson 4: Spatial data visualization .pdf
- Lesson 5: Multivariate data visualization .pdf
- Lesson 6: Trees, graphs, networks, texts and documents .pdf
- Lesson 7: Basic interactions concepts .pdf
- Lesson 8: Designing efficient visualizations .pdf
Final Project
- Instructions: Instructions .pdf